BDSwiss App
Download & start trading

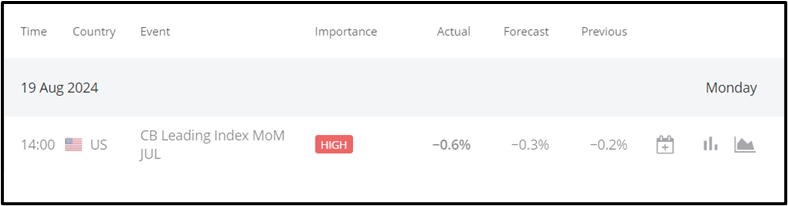
Previous Trading Day’s Events (19.08.2024)
U.S CB Leading Index m/m: The composite index, measuring changes across 10 economic indicators for July, was forecasted at -0.4% but actual data revealed a deeper decline at -0.6%.
Winners Vs Losers In The Forex Market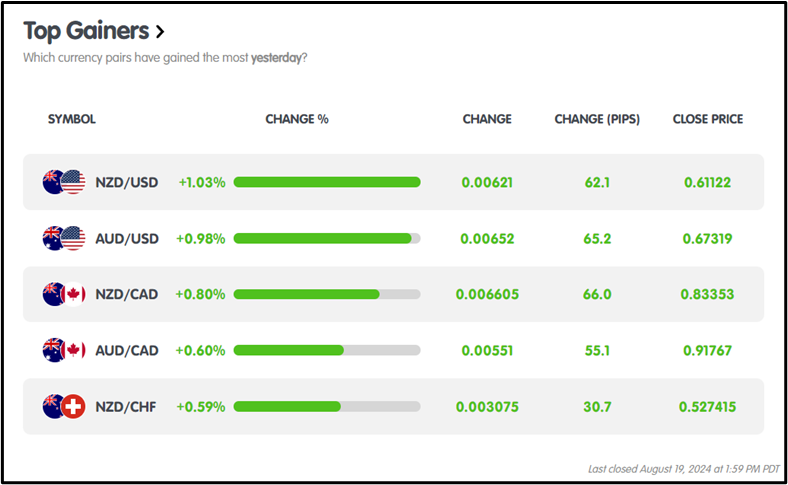
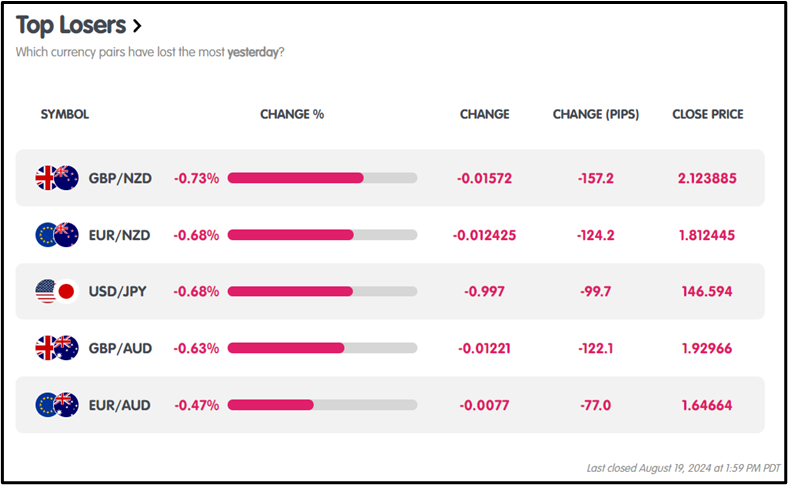 On August 19, 2024, in the forex market, NZDUSD led gains with a +1.03% move, adding 62.1 pips, while GBPNZD dropped by -0.73%, losing 157.2 pips.
News Reports Monitor – Previous Trading Day (19.08.2024)
Server Time / Timezone EEST (UTC+03:00)
 Tokyo Session: No key data.
London Session: No key data.
New York Session: USD turned bearish at 14:00 GMT as the composite index for July, expected at -0.4%, dropped to -0.6%.
General Verdict: The trading day saw little movement in the Tokyo and London sessions due to a lack of key data. In contrast, the New York session witnessed a bearish shift in USD following a disappointing composite index report for July.
FOREX MARKETS MONITOR
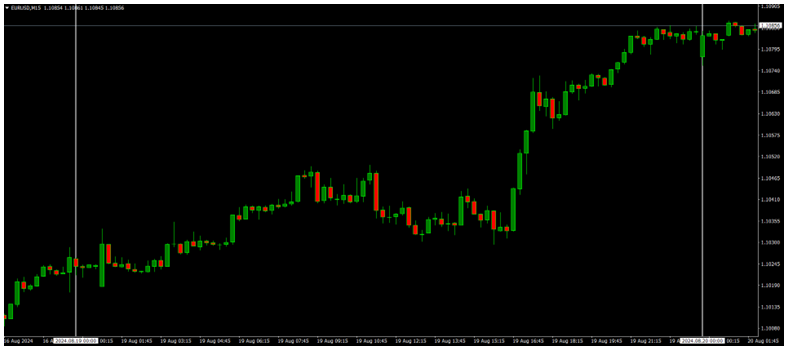
EURUSD (19.08.2024) 15m Chart Summary
Server Time / Timezone EEST (UTC+03:00)
Price Movements
EURUSD maintained a bullish trend, opening at 1.10248 and closing at 1.10846, with a daily high of 1.10850 and a low of 1.10185.
 CRYPTO MARKETS MONITOR
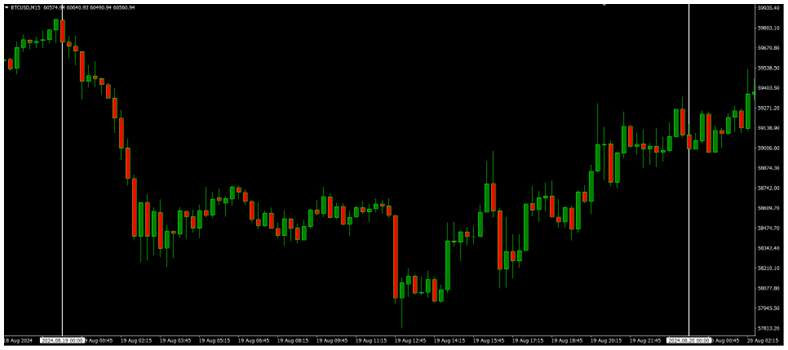
BTCUSD (19.08.2024) 15m Chart Summary
Server Time / Timezone EEST (UTC+03:00)
Price Movements
BTCUSD maintained a bearish trend, opening at $59,860.53, peaking at $59,860.55, dipping to a low of $57,776.58, and closing weaker at $59,048.60.
 STOCKS MARKETS MONITOR
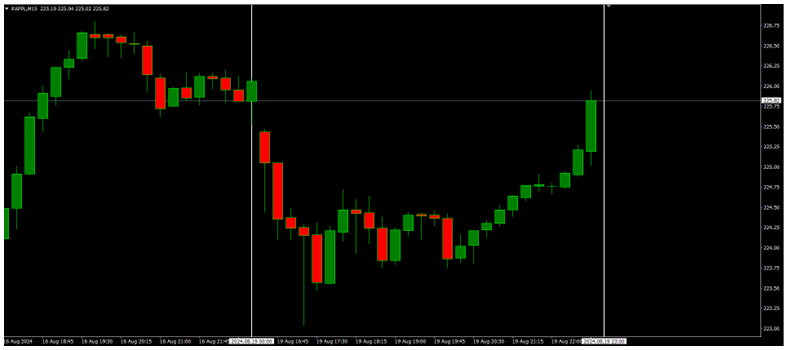
APPLE (19.08.2024) 15m Chart Summary
Server Time / Timezone EEST (UTC+03:00)
Price Movements
Apple showed overall bullish momentum, opening at $225.32, peaking at $225.83, and closing slightly higher at $225.82, with a daily low of $222.92.
 INDICES MARKETS MONITOR
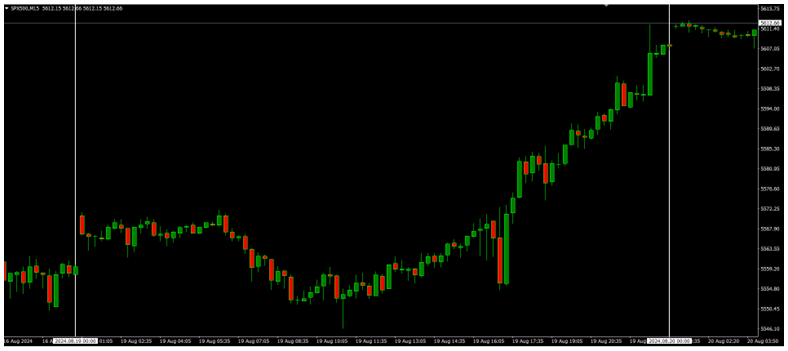
S&P 500 (19.08.2024) 15m Chart Summary
Server Time / Timezone EEST (UTC+03:00)
Price Movements
The S&P 500 maintained a bullish trend, opening at $5569.23 and closing at $5606.95, with an intraday high of $5612.40 and a low of $5545.09.
 COMMODITIES MARKETS MONITOR
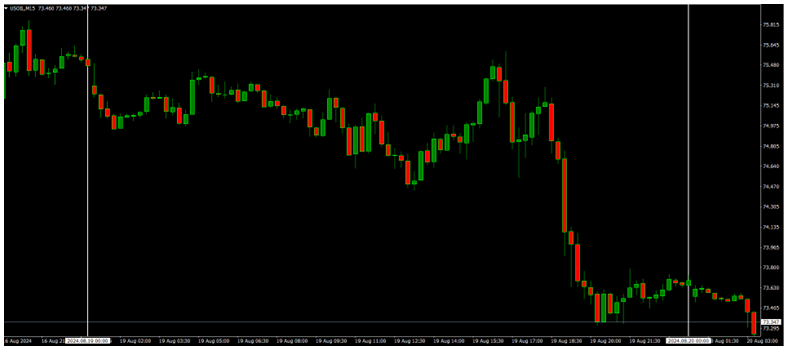
USOIL (19.08.2024) 15m Chart Summary
Server Time / Timezone EEST (UTC+03:00)
Price Movements
USOIL exhibited a bearish trend, opening at $75.326 and closing lower at $73.677. The intraday low reached $73.269, while the high touched $75.615.
 News Reports Monitor – Today Trading Day (20.08.2024)
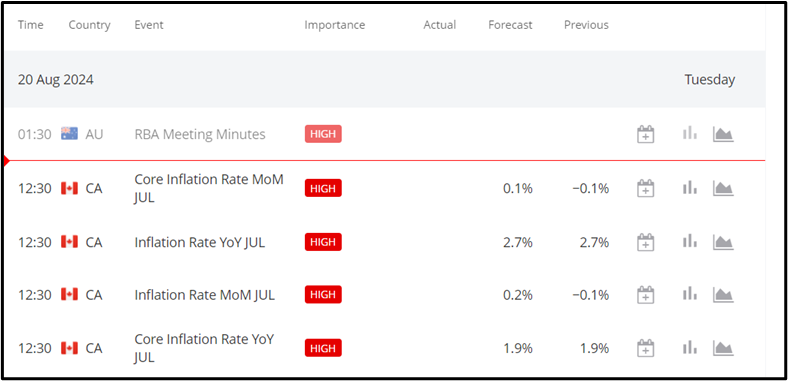 Tokyo Session: RBA Minutes (AUD) – Bullish catalyst on release at 1:30 AM GMT.
London Session: No major market movers.
New York Session: Canadian CPI data is set to impact the CAD, with the Core Month-over-Month (MoM) forecast at 0.1%, the Year-over-Year (YoY) at 2.7%, and the overall MoM at 0.2%. Core YoY is anticipated to be 1.9%.
Impact: CAD rallies if data exceeds expectations; dips if it underperforms.
General Verdict:
Sources:
https://km.bdswiss.com/economic-calendar/
https://www.conference-board.org/
Metatrader 4
 Da-Costa Assumang
Posted on 06 September, 2024 at 10:55 GMT
Posted on 05 September, 2024 at 10:53 GMT
Posted on 04 September, 2024 at 12:19 GMT
Posted on 03 September, 2024 at 12:45 GMT
Posted on 02 September, 2024 at 10:36 GMT