


Market Analysis Review
U.S. inflation surprise dropped to 3%, Massive USD weakening, JPY strengthened, Gold jumped, Crude oil stable, U.S. indices plunged
Previous Trading Day’s Events (11.07.2024)
“Barring rogue price data in July, the Fed has a checkered flag to reduce rates in September,” said Brian Bethune, an economics professor at Boston College. “This guidance will be solidified at the July meeting.”
The CPI dipped 0.1% last month, the first drop since May 2020, after being unchanged in May. The CPI was weighed down by a 3.8% decline in gasoline prices, which followed a 3.6% decrease in May.
In the 12 months through June, the CPI climbed 3.0%, the smallest gain since June 2023. That followed a 3.3% advance in May. The annual increase in consumer prices has slowed from a peak of 9.1% in June 2022.
Fed Chair Jerome Powell has acknowledged the improving trend in price pressures but told lawmakers this week he was not yet ready to declare inflation had been beaten and that “more good data” would strengthen the case for rate cuts.
Initial claims for state unemployment benefits fell 17,000 to a seasonally adjusted 222,000 for the week ended July 6, the lowest level since late May.
“There is light at the end of the tunnel finally after the central bank’s long battle with inflation and interest rate cuts, lots of them, are on the way,” said Christopher Rupkey, chief economist at FWDBONDS.
Source: https://www.reuters.com/markets/us/us-consumer-prices-unexpectedly-fall-june-2024-07-11/
______________________________________________________________________
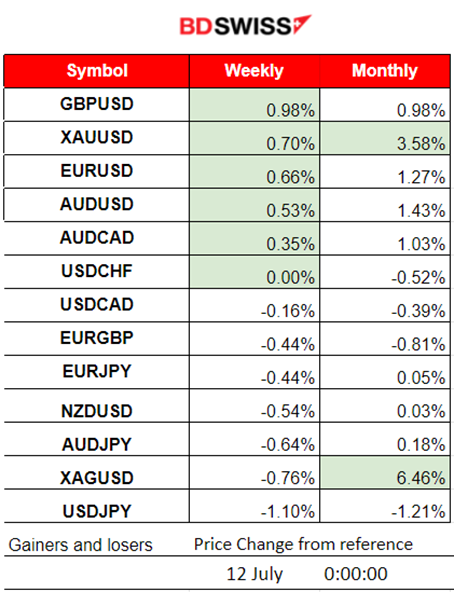
Winners vs Losers
USD pairs (with USD as a quote) have reached the top as the USD has weakened significantly after the release of the inflation report yesterday for the U.S. A lower-than-expected reported figure has caused a massive shock in the market. USDJPY reached the bottom since the USD depreciated while the JPY experienced strength after a possible intervention by the BOJ at that time.
 ______________________________________________________________________
News Reports Monitor – Previous Trading Day (11.07.2024)
Server Time / Timezone EEST (UTC+03:00)
- Midnight – Night Session (Asian)
No important news announcements, no important scheduled releases.
- Morning – Day Session (European and N. American Session)
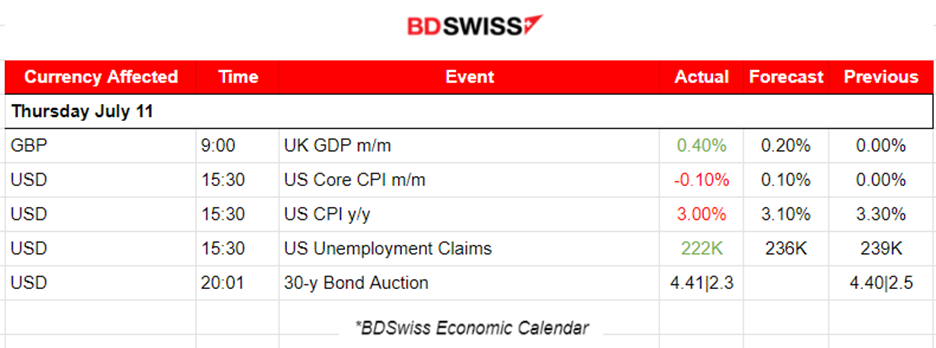
The UK monthly GDP figure released at 9:00 reported growth for the U.K. economy. Monthly real gross domestic product (GDP) is estimated to have grown by 0.4% in May 2024 after showing no growth in April 2024. The GBP appreciated only momentarily. The intraday shock was minimal.
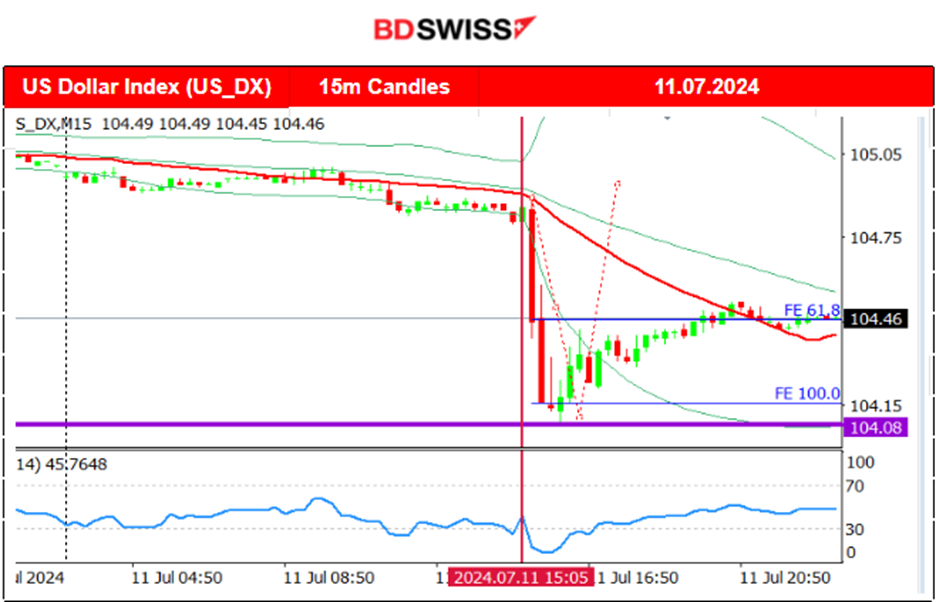
At 15:30 a massive intraday shock took place affecting the markets. The strongly anticipated U.S. inflation report was reported surprisingly lower than expected at 3%, down from 3.3%. The USD depreciated heavily. USDJPY fell near 400 pips before retracing. The initial response for U.S. indices was a jump and then a full reversal with a non-stop steady drop. Gold Jumped.
U.S. unemployment claims were actually reported lower at 222K, close to figures seen in June, but the market completely avoided this release.
General Verdict:
 __________________________________________________________________
FOREX MARKETS MONITOR
EURUSD (11.07.2024) 15m Chart Summary
Server Time / Timezone EEST (UTC+03:00)
Price Movement
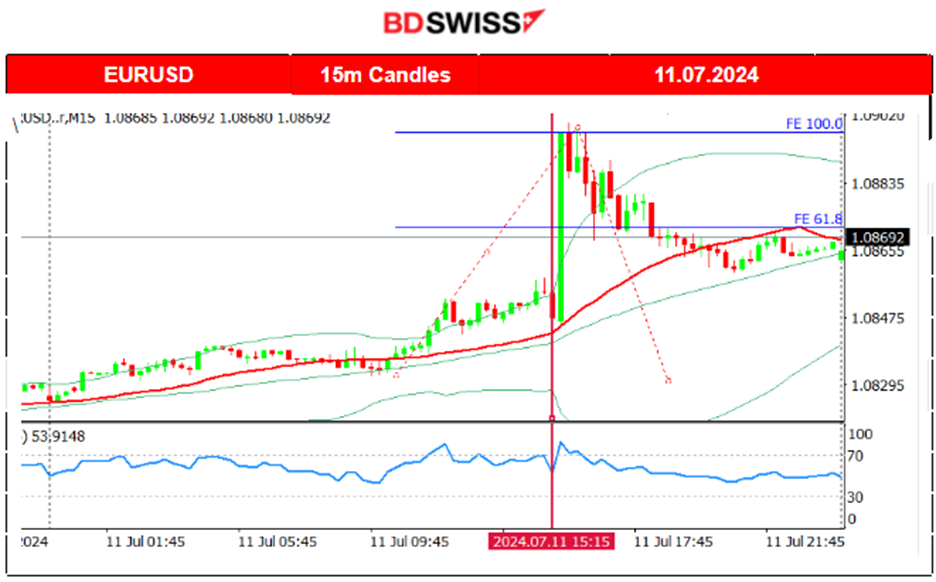
The pair started to move early to the upside due to USD steady depreciation. However, at the time of the inflation report for the U.S., the USD was affected greatly by weakening causing the EURUSD to jump near 55 pips before retracement took place as depicted on the chart, back to the 30-period MA and the 61.8 Fibo level.
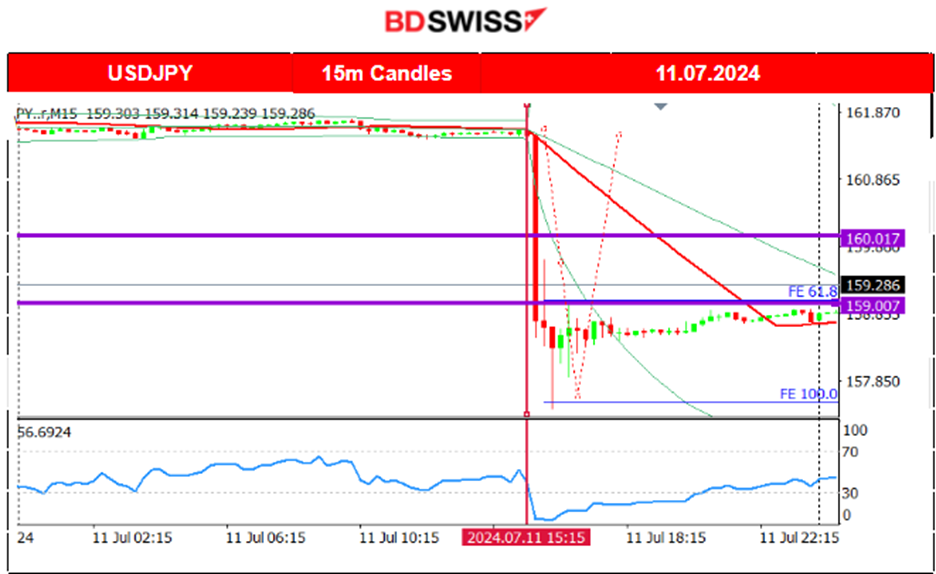
 USDJPY (11.07.2024) 15m Chart Summary
Server Time / Timezone EEST (UTC+03:00)
Price Movement
The pair experienced a sharp drop reaching nearly 400 pips within the hour after the U.S. inflation report release. The USD has weakened significantly but the JPY was also gaining strength by a possible Bank intervention that can explain such huge moves. After the drop, the USDJPY found support at near 157.4 and continued with a retracement, back to the 30-period MA at near the 159 level.
 ___________________________________________________________________
CRYPTO MARKETS MONITOR
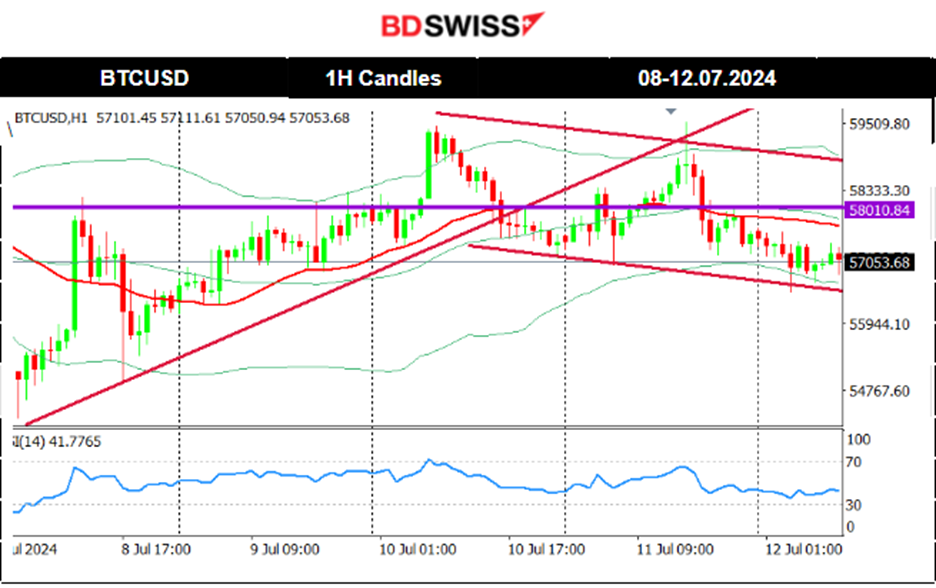
BTCUSD (Bitcoin) Chart Summary 1H
Server Time / Timezone EEST (UTC+03:00)
Price Movement
On the 5th of July, the price fell further breaking the 57K USD level and dropped to the next support at 54K USD. Since then the market recovered and corrected by moving upwards and crossing the 30-period MA. The price remained close to the MA as it continued moving sideways with a clear mean level at nearly 57K USD. The latest price data formed a triangle indicating that volatility levels lowered and as mentioned in our previous analysis upon triangle breakout on the 10th it led to a jump. The price remained higher, settling at 58K USD but eventually moved to the downside since the news release yesterday. It currently remains below the 30-period MA with a possible downward path continuation.
 Crypto sorted by Highest Market Cap:
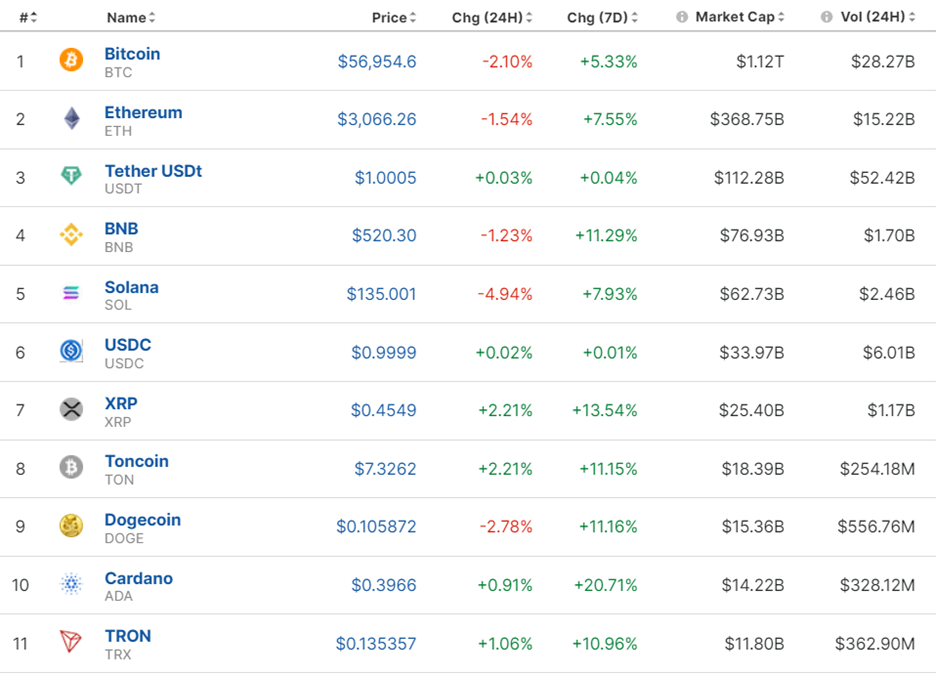
Most Crypto suffered losses lately. The last few days however we see some correction, eliminating some of the losses. No significant correction has taken place so far though.
https://www.investing.com/crypto/currencies
______________________________________________________________________
EQUITY MARKETS MONITOR
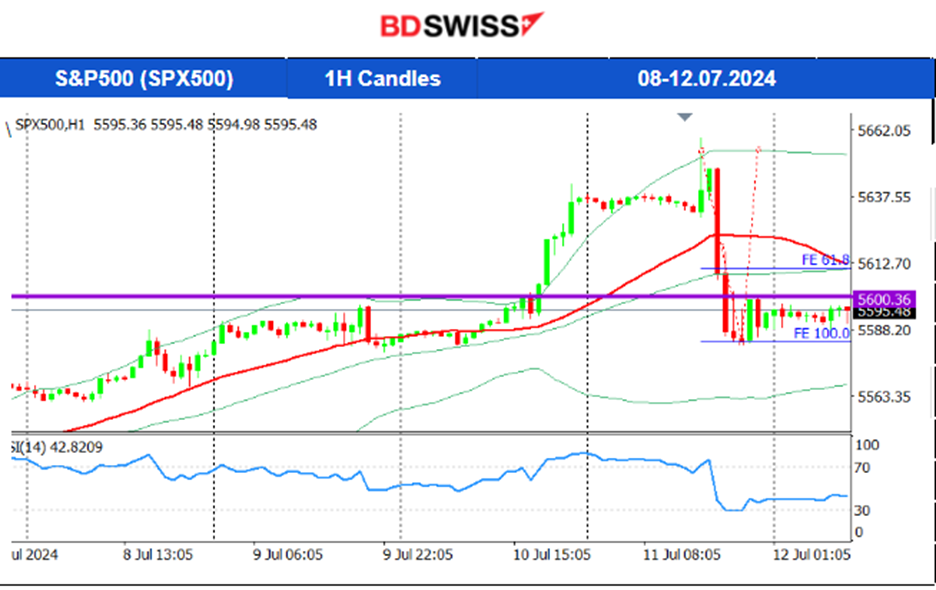
S&P500 (SPX500) 4-Day Chart Summary
Server Time / Timezone EEST (UTC+03:00)
Price Movement
This week started with a more aggressive upward movement for the index. Looking at things from afar, no significant correction is expected yet. A clear uptrend. The RSI is indeed showing bearish signals. That however must be supported with downside breakouts and that did not happen yet. Instead, U.S. stocks got a boost yesterday, ahead of the U.S. inflation report, remaining on the uptrend that started on July 2nd. There is a chance that the CPI inflation y/y figure will not be reported as expected and a huge index drop will take place. This will be surprising since the economic conditions in the U.S. are showing signs of deterioration. Expectations about lowered borrowing costs starting in September are boosting investment in stocks. Will this risk-on mood continue though? A disappointing inflation figure might turn things around.
 ______________________________________________________________________
COMMODITIES MARKETS MONITOR
USOIL (WTI) 4-Day Chart Summary
Server Time / Timezone EEST (UTC+03:00)
Price Movement
The price settled near the 80.5 USD/b level, below the MA, but on the 10th it eventually reversed to the upside. This movement was a correction/retracement to the 61.8 Fibo level as depicted on the chart. The price boost to the upside was a result of a reported decline, -3.4M barrels in Crude Oil Inventories in the U.S. against a forecast of 0.7M growth. During the U.S. inflation news yesterday on the 11th Crude oil prices saw some retreat but eventually reversed to the upside. After several tests of the resistance 82.10 USD/b, it finally broke that resistance today. The expectation is an upward price path from here on.
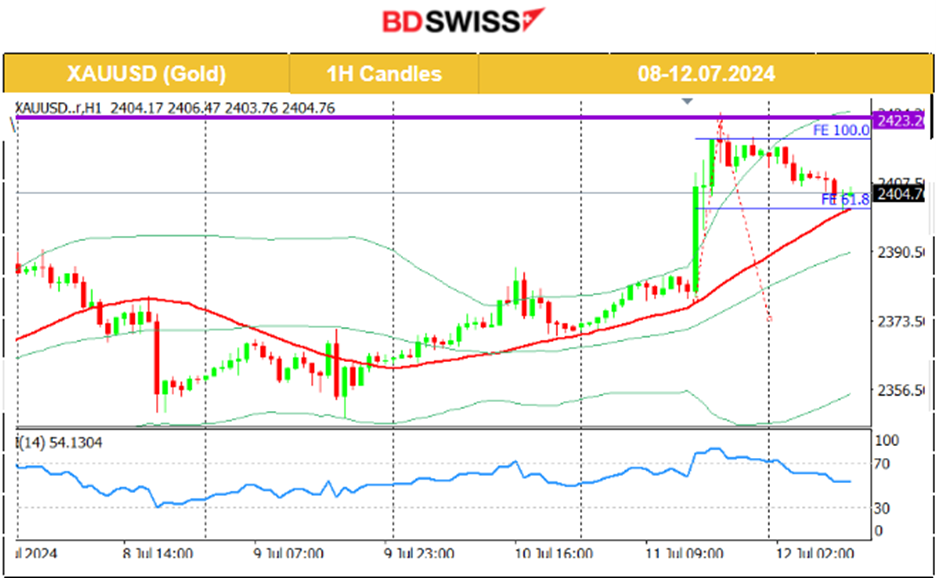
 XAUUSD (Gold) 4-Day Chart Summary
Server Time / Timezone EEST (UTC+03:00)
Price Movement
On the 8th of July, the price of Gold moved significantly to the downside. It crossed the 30-period MA and found support at 2,350 USD/oz before it retraced to the MA. After several unsuccessful breakouts of that support, the price eventually moved to the upside on the 9th of July. The target level of 2,380 USD/oz was reached as per our forecast in the previous analysis and the price even moved higher reaching the resistance at 2,387 USD/oz before retracement took place. On the 11th the USD weakening that took place during the U.S. inflation report release caused the price to jump, initially reaching at near the 2400 USD/oz. After testing that resistance intraday another breakout led to the price reaching even the resistance near 2,423 USD/b before retracing to the MA. Friday today, with volatility levels lowering and with no clear data to suggest any short-term forecast.
 ______________________________________________________________
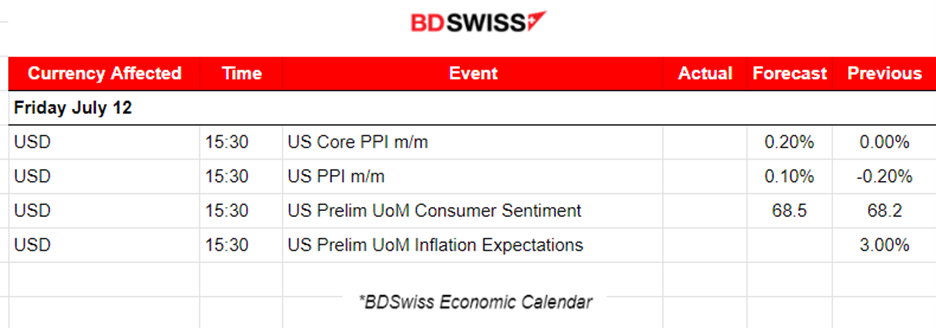
News Reports Monitor – Today Trading Day (12.07.2024)
Server Time / Timezone EEST (UTC+03:00)
- Midnight – Night Session (Asian)
No important news announcements, no important scheduled releases.
- Morning – Day Session (European and N. American Session)
During the release of the PPI data at 15:30, the USD pairs could see an intraday shock. The forecast is for a growth of prices, however, we saw yesterday that the annual CPI inflation figure was reported lower and today we might have surprises with the PPI. USD pairs could be greatly affected again.
The Preliminary Consumer and Inflation reports are going to have an impact, however, the effect could be already priced in since the forecast is making sense. The latest labour market data for the U.S. suggest cooling that could cause interest rate policy change soon, September probably. The forecast is not far away from the previous figure and a 3% inflation expectation could be the real case.
General Verdict:
______________________________________________________________
 Marios Kyriakou
Recent Posts
Posted on 02 May, 2025 at 12:00 GMT
Posted on 29 April, 2025 at 12:00 GMT
Posted on 28 April, 2025 at 12:00 GMT
Posted on 25 April, 2025 at 12:00 GMT
Posted on 23 April, 2025 at 11:00 GMT