BDSwiss App
Download & start trading

Previous Trading Day’s Events (20.08.2024)
RBA Meeting Minutes: RBA kept its cash rate at 4.35% for the sixth consecutive meeting, aligning with market expectations, while maintaining the Exchange Settlement balance rate at 4.25% and signalling a continued restrictive stance until inflation targets are achieved.
Canada Inflation Rate: Dropped to 2.5% YoY in July 2024 from 2.7% in June, the slowest since March 2021.
Canada CPI Trimmed-mean: Fell to 2.7% YoY in July 2024, the lowest since June 2021, below the 2.8% forecast.
Canada CPI MoM: Increased by 0.40% in July 2024.
Winners Vs Losers In The Forex Market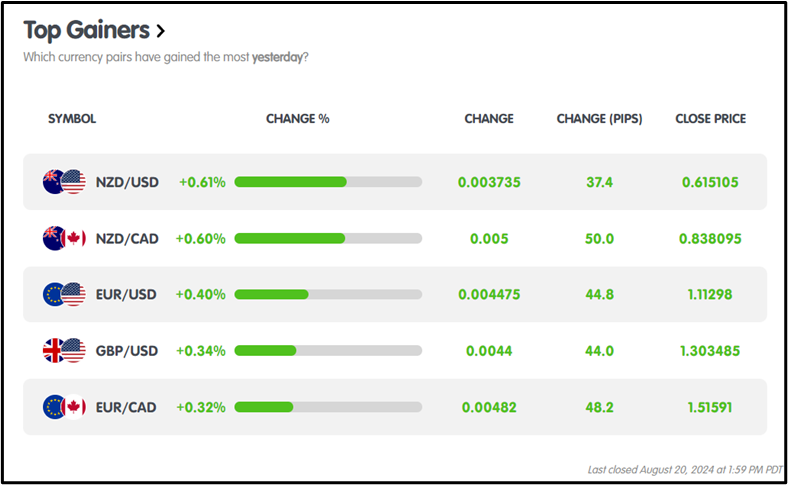
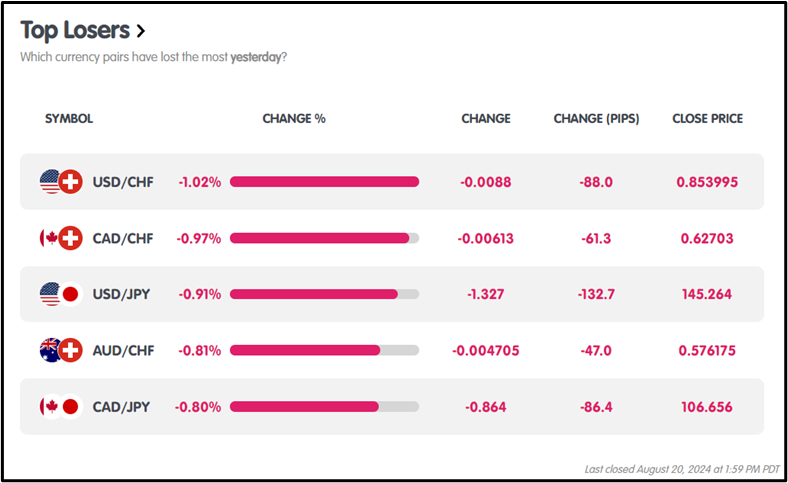 On August 20th, 2024, NZDUSD surged as the top performer, rallying +0.61% with a gain of 37.4 pips, while USDCHF plunged as the biggest loser, dropping -1.02% and shedding 88.0 pips.
News Reports Monitor – Previous Trading Day (20.08.2024)
Server Time / Timezone EEST (UTC+03:00)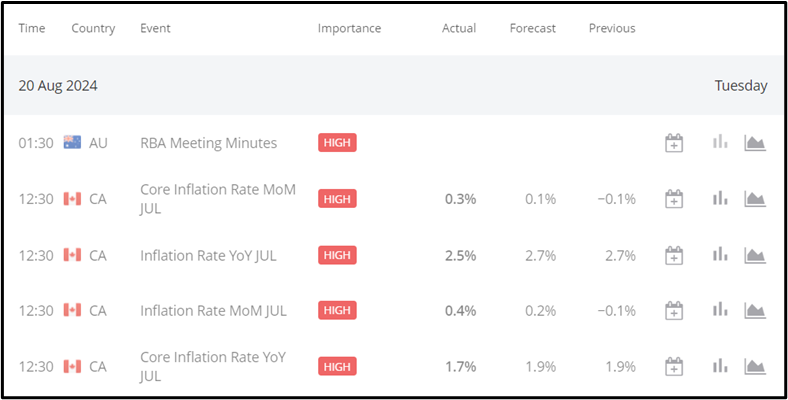
RBA Cash Rate: Bullish impact at 1:30 am GMT with the cash rate steady at 4.35% and Exchange Settlement at 4.25%.
2. London Session: No significant news
3. New York Session:
Canada Inflation Rate: Bearish impact at 12:30 pm GMT, with YoY inflation dropping to 2.5% from 2.7%.
Canada CPI Trimmed-mean: Bearish impact at 12:30 pm GMT, with YoY decreasing to 2.7%, below the 2.8% forecast.
Canada CPI MoM: Bearish impact at 12:30 pm GMT, with a 0.40% increase.
General Verdict:
The RBA’s steady rates triggered a bullish move in the Tokyo session, while Canadian inflation data caused a bearish reaction in the London and New York sessions.
FOREX MARKETS MONITOR
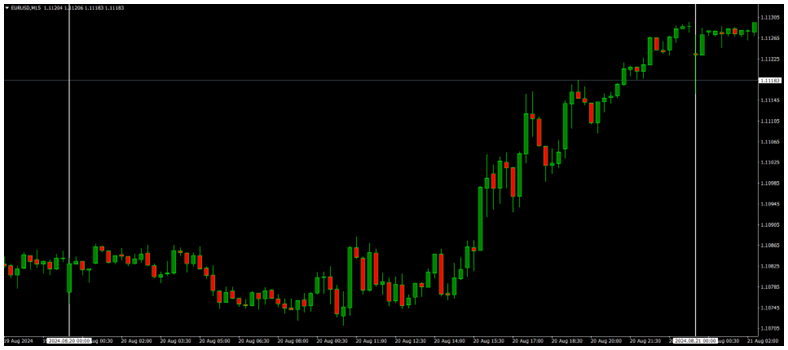
EURUSD (20.08.2024) 15m Chart Summary
Server Time / Timezone EEST (UTC+03:00)
Price Movements
EURUSD was bullish, opening at 1.10762 and closing at 1.11288, with the day’s low at 1.10705 and the high at 1.10763.
 CRYPTO MARKETS MONITOR
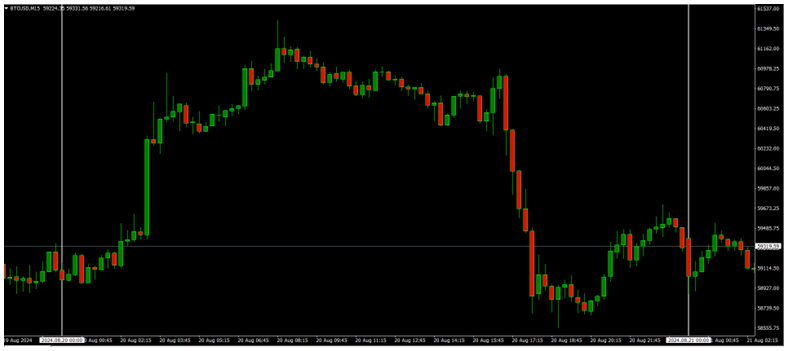
BTCUSD (20.08.2024) 15m Chart Summary
Server Time / Timezone EEST (UTC+03:00)
Price Movements
BTCUSD showed a bullish trend, opening at $59,048.60 and closing at $59,304.81, with an intraday high of $61,457.33 and a low of $58,507.32.
 STOCKS MARKETS MONITOR
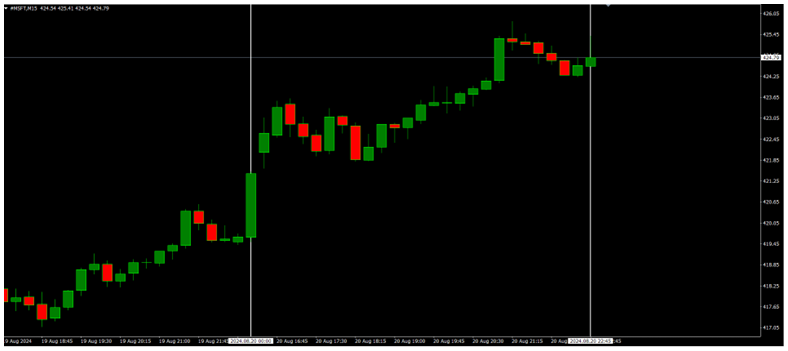
Microsoft Corporation (20.08.2024) 15m Chart Summary
Server Time / Timezone EEST (UTC+03:00)
Price Movements
Microsoft was bullish, opening at $422.13, closing at $424.79, with a high of $425.74 and a low of $421.49 for the day.
 EQUITY MARKETS MONITOR
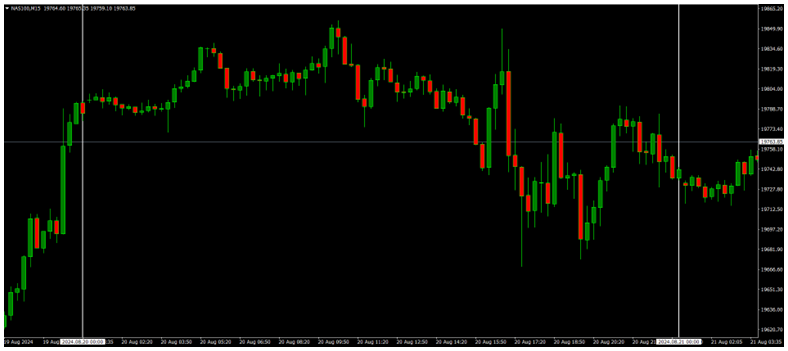
NAS 100 (20.08.2024) 15m Chart Summary
Server Time / Timezone EEST (UTC+03:00)
Price Movements
The NAS 100 was bearish, opening at $19,797.95 and closing at $19,736.90, with a high of $19,865.05 and a low of $19,658.69.
 USOIL MARKETS MONITOR
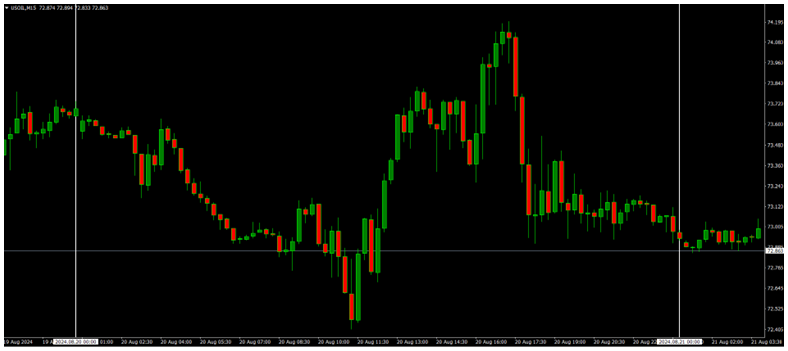
USOIL (20.08.2024) 15m Chart Summary
Server Time / Timezone EEST (UTC+03:00)
Price Movements
USOIL traded bearish, opening at $73.592 and closing at $72.895, with a daily high of $74.238 and a low of $72.402.
 News Reports Monitor – Today Trading Day (21.08.2024)
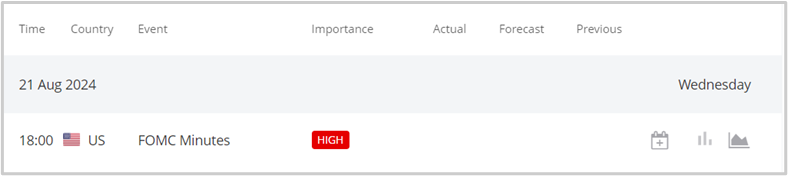
FOMC Meeting Minutes were more hawkish than expected, which is good for the USD.
Sources:
https://km.bdswiss.com/economic-calendar/
Metatrader 4
 Da-Costa Assumang
Posted on 06 September, 2024 at 10:55 GMT
Posted on 05 September, 2024 at 10:53 GMT
Posted on 04 September, 2024 at 12:19 GMT
Posted on 03 September, 2024 at 12:45 GMT
Posted on 02 September, 2024 at 10:36 GMT