BDSwiss App
Download & start trading


This article delves into the dynamic Q2 (April – June) performance review of gold, showcasing a turbulent journey. Gold prices surged to all-time highs mid-April, surpassing $2,400 per ounce, driven by strong central bank buying and investor optimism. Despite geopolitical and economic uncertainties, gold hit its peak on May 20 at $2,450.05 before pulling back. Explore detailed insights into gold’s price activity, central bank buying trends, and ETF flows, and discover the forecasts for Q3 trends here!
Gold Shatters All-Time Price Records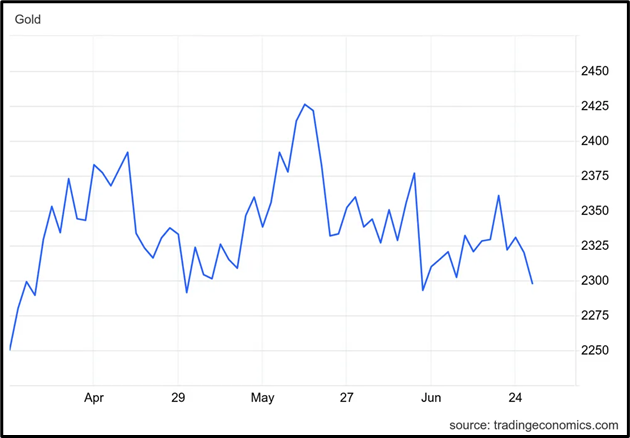
Gold prices soared to all-time highs in Q2 but retraced before quarter-end. Following a record-setting Q1, gold entered Q2 with strong bullish momentum, breaking above $2,400 per ounce mid-April, setting new highs.
Starting April at $2,250, gold found support from investors anticipating a June Fed rate cut and robust central bank buying. Additional support came in May from geopolitical and sovereign debt concerns in China and the Middle East. On May 20, gold peaked at $2,450.05.
Gold’s Q2 performance was driven by factors including central bank purchases, strong Chinese retail demand, and improved sentiment among western investors, curbing outflows from gold ETFs.
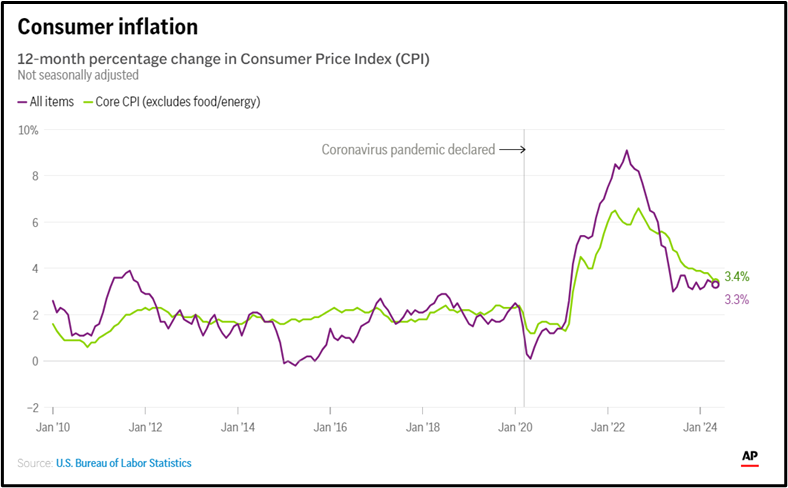 Gold’s Q2 rally aligned with an improved US economic outlook. April’s slight dip in the consumer price index fueled speculation of a potential Fed rate cut.
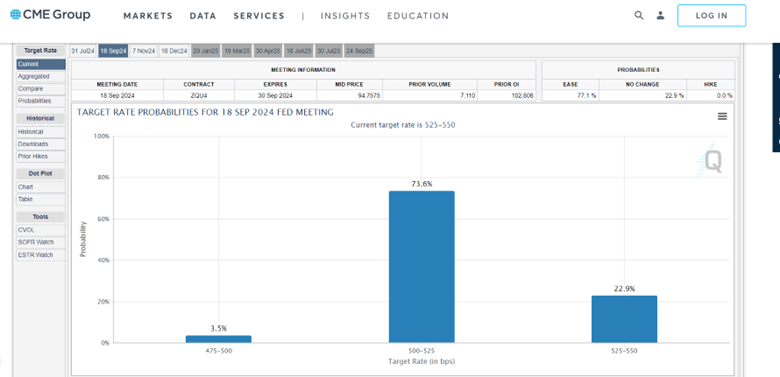 A June rate cut didn’t materialize, and improved personal consumption expenditures, CPI data for May and June, and a robust May jobs report have created mixed signals. CME Group’s FedWatch tool now indicates a 73.6% probability of a rate cut in September. This uncertainty has introduced resistance for gold, which closed Q2 at $2,325.
Central Banks Continue to Shape the Bullion Market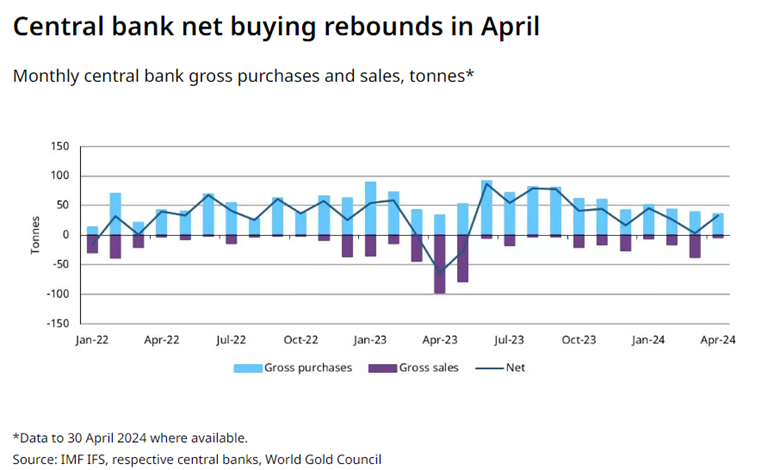 Central banks were net buyers of gold in Q1, accumulating 289.7 metric tons (MT), consistent with 2022 and 2023 levels. Leading acquisitions were Turkey (30.12 MT), China (27.06 MT), and India (18.51 MT). This bullish trend continued into early Q2, with central banks adding 33 MT in April. Turkey increased holdings for the 11th consecutive month by 8 MT, while China’s purchases dropped significantly to 2 MT, well below its 17-month average of 18 MT.
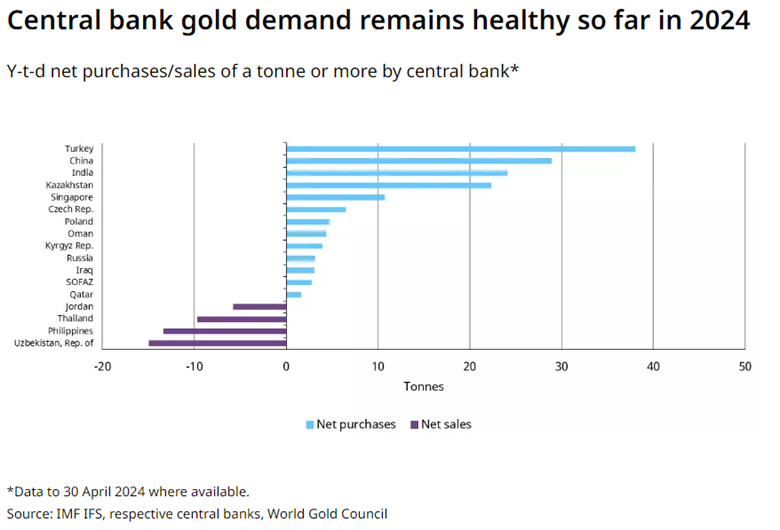 While May’s data remains incomplete, reports suggest the People’s Bank of China paused gold purchases for the first time in 18 months. Analysts note ongoing unreported acquisitions by the central bank. Speculation indicates China may resume buying once prices retreat from recent highs. As of April, China’s gold reserves totaled 2,265 MT, representing 4.9% of its forex holdings.
Gold ETF Outflow Decline
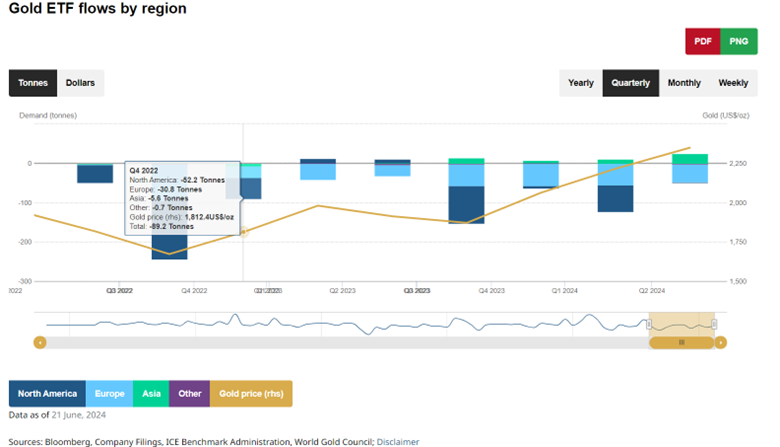 Gold ETFs experienced continued outflows in Q2, though the pace slowed. Western funds saw reduced outflows, while funds in other regions recorded increased inflows.
The World Gold Council reported that in Q1, North American and European gold funds experienced a combined outflow of 122.4 MT, while Asian funds saw an inflow of 9.9 MT. In Q2, North American and European outflows decreased to 47.7 MT, and Asian inflows surged to 24.2 MT.
As of May 24, Chinese ETFs led the top 10 fund inflows, securing four positions, including the top three, and representing 18.6 MT of Asian demand. Huaan Yifu Gold ETF (SHA:518880) topped the list with a 7.4 MT increase in holdings. Other notable inflows came from Japan and India, contributing 4.3 MT.
 US and European funds saw notable inflows, with UBS ETF Gold (SWX:AUUSI), SPDR Gold Shares (NYSE:GLD), Sprott Physical Gold Trust (NYSE:PHYS), and Royal Mint Responsibly Sourced Physical Gold ETC (LSE:RMAU) among the top gainers. Conversely, the worst-performing ETFs by flows were predominantly European, including six from Germany and the UK, two Swiss, one French, and one American fund in the bottom 10.
Q2 XAUUSD Technical Analysis Review 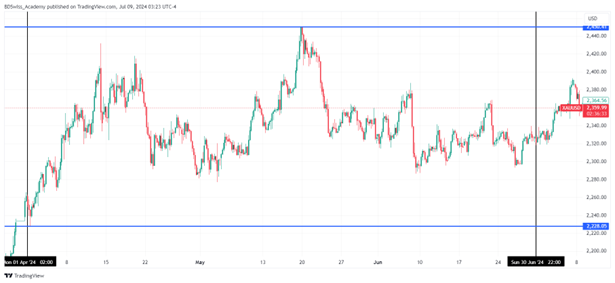 Throughout Q2 FY2024, Gold exhibited a bullish trend, commencing at $2,261.58 and closing at $2,321.52. The quarter began on April 1st at $2,261.58, reaching its lowest point of $2,228.05 on the same day. By the end of April, prices surged to $2,450.41, marking the highest point for the month. However, by May 24th, prices retreated to $2,276.52 before climbing to an all-time high of $2,458.28, the peak for Q2. Closing out June, prices settled at $2,321.52 after briefly dipping to $2,286.13.
Q3 XAUUSD Technical Analysis Forcast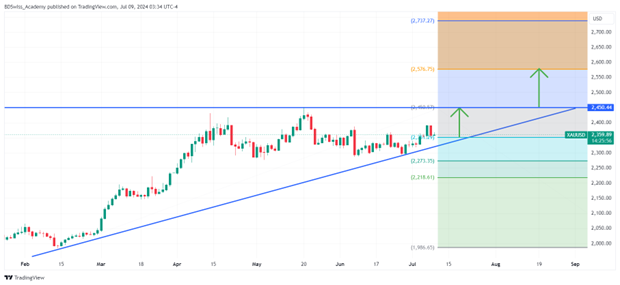
An ascending triangle pattern has emerged on the daily chart of XAUUSD, with the current price near $2359.89 breaking above the $2351.29 resistance level. This breakout suggests potential upward movement towards the $2450.57 all-time high, with further bullish sentiment targeting $2576.75 upon breaking above $2450.57.
Conversely, failure of the breakout could lead to a downward movement towards $2273.35, and if this support level is breached, the price might decline further to $2218.61.
https://images.app.goo.gl/ekt5Et6ffpzpERGy8
https://www.cmegroup.com/markets/interest-rates/cme-fedwatch-tool.html
 Da-Costa Assumang
Posted on 26 August, 2024 at 09:19 GMT
Posted on 26 August, 2024 at 09:17 GMT
Posted on 26 August, 2024 at 09:13 GMT
Posted on 26 August, 2024 at 09:11 GMT
Posted on 23 August, 2024 at 09:18 GMT