BDSwiss App
Download & start trading

Previous Trading Day’s Events (12.07.2024)
“There does not appear to be much inflation pressure percolating on the factory floors that might affect the prices that consumers pay at the shops and malls,” said Christopher Rupkey, chief economist at FWDBONDS.
The producer price index for final demand rose 0.2% last month after being unchanged in May. In the 12 months through June, the PPI increased 2.6%. That was the largest year-on-year gain since March 2023 and followed a 2.4% advance in May.
PCE inflation was forecasted to have edged up 0.1% in June after being unchanged in May. Estimates for the core PCE price index converged around a 0.15% rise. Core inflation ticked up 0.1% in May. Both PCE and core inflation were seen increasing 2.5% year-on-year in June after rising 2.6% in May.
Source: https://www.reuters.com/markets/us/us-producer-prices-rise-moderately-june-2024-07-12/
______________________________________________________________________
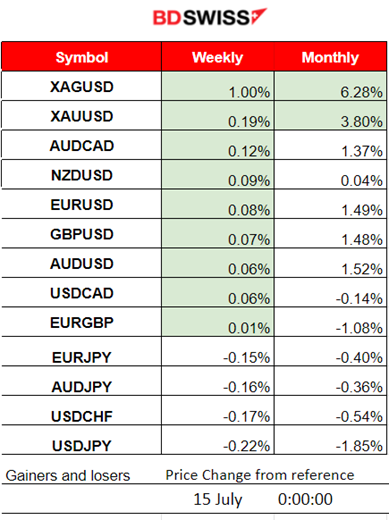
Winners vs Losers
Metals have moved significantly upwards, early at the start of this week with Silver (XAGUSD) gaining 1%. It is also leading this month with 6.28% gains so far.
 ______________________________________________________________________
News Reports Monitor – Previous Trading Day (12.07.2024)
Server Time / Timezone EEST (UTC+03:00)
No important news announcements, no important scheduled releases.
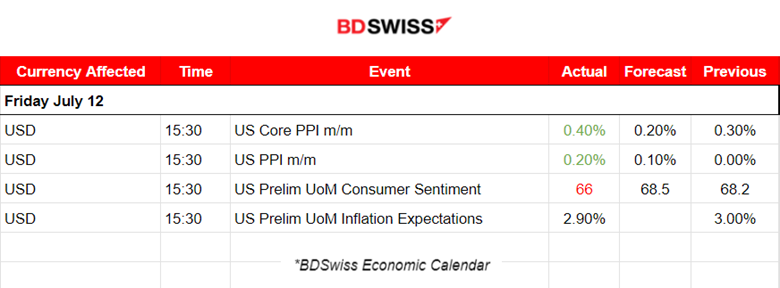
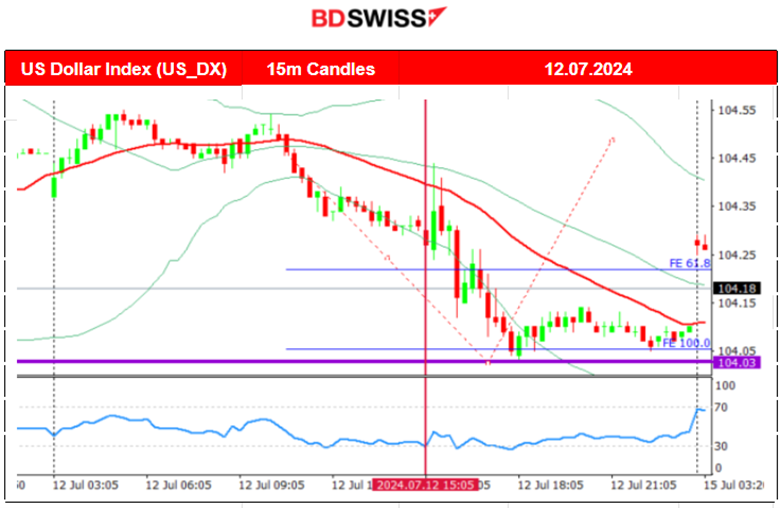
The U.S. PPI data released at 15:30 showed that the wholesale price inflation accelerated in June beating expectations. The Core reading was 0.2% higher than the expected figure. That’s not favourable for the Fed and the economy. Consumer prices declined on a monthly basis for the first time in four years according to the recent inflation report and this could be a step back in the path of reducing interest rates. At the time of the release the U.S. dollar was affected with a minor shock, however a steady depreciation followed.
The U.S. consumer sentiment declined unexpectedly to the lowest level in eight months and caused further depreciation of the currency. The sentiment index fell to 66 in July from 68.2, according to the preliminary reading from the University of Michigan.
Inflation expectations improved actually, with a preliminary figure to be reported 2.9%, above the 2.3-3.0% range seen in the two years prior to the pandemic. This reading coincides with the recent inflation data, at least for the CPI inflation.
General Verdict:
 __________________________________________________________________
FOREX MARKETS MONITOR
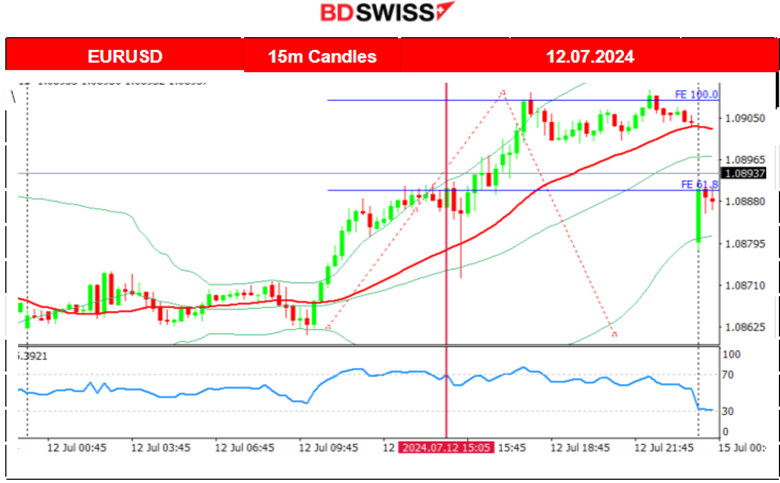
EURUSD (12.07.2024) 15m Chart Summary
Server Time / Timezone EEST (UTC+03:00)
Price Movement
The pair was moving with low volatility and sideways before the start of the European session. After entering the session the pair started to move significantly upward due to USD early depreciation. The PPI news at 15:30 caused an intraday shock that caused minor initial USD appreciation causing the EURUSD to drop only to reverse immediately to the upside. The pair continued to move upwards due to more USD weakening until it found resistance at near 1.09100 before it slowed. No retracement took place but on Monday 15th of July, the market opened with a downward gap.
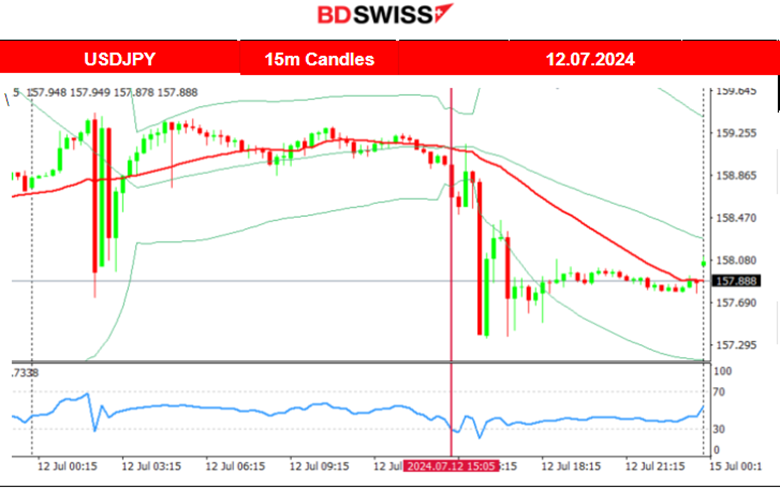
 USDJPY (12.07.2024) 15m Chart Summary
Server Time / Timezone EEST (UTC+03:00)
Price Movement
During the early hours of the Asian session, the pair experienced volatility from non-apparent causes since there were no important scheduled releases or announcements. It looks like banks trading large volumes of JPY in an attempt to counter its weakness. During the U.S. news at 15:30, the USD did not depreciate as much, however, the pair experienced a huge drop of 140 pips before retracing to the MA. The drop was also observed with other JPY pairs obviously due to high JPY buying.
 ___________________________________________________________________
CRYPTO MARKETS MONITOR
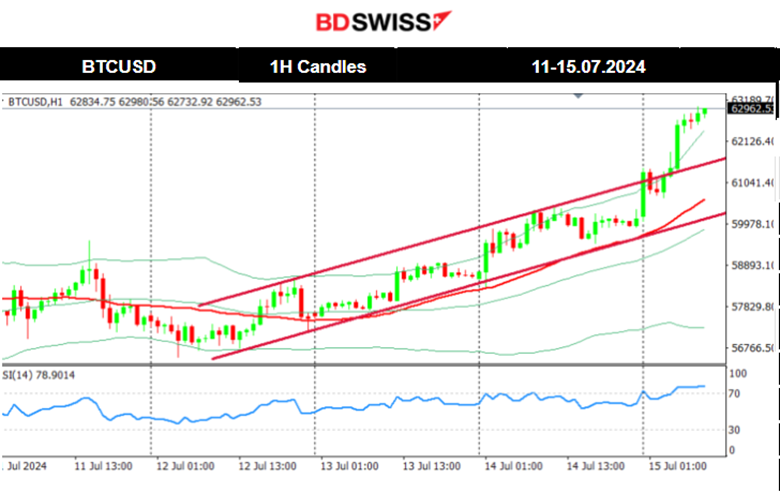
BTCUSD (Bitcoin) Chart Summary 1H
Server Time / Timezone EEST (UTC+03:00)
Price Movement
The latest price data formed a triangle indicating that volatility levels lowered and as mentioned in our previous analysis upon triangle breakout on the 10th, it led to a jump. The price remained higher, settling at 58K USD but eventually moved to the downside until the 12th. On that day the price reversed to the upside, crossing the 30-period MA on its way. It was the start of an uptrend that surprisingly led the price to continue steadily upward during the weekend. At the start of the week, on Monday 15th, the price jumped to nearly 63K USD. That is a remarkable recovery for Bitcoin’s price.
 Crypto sorted by Highest Market Cap:
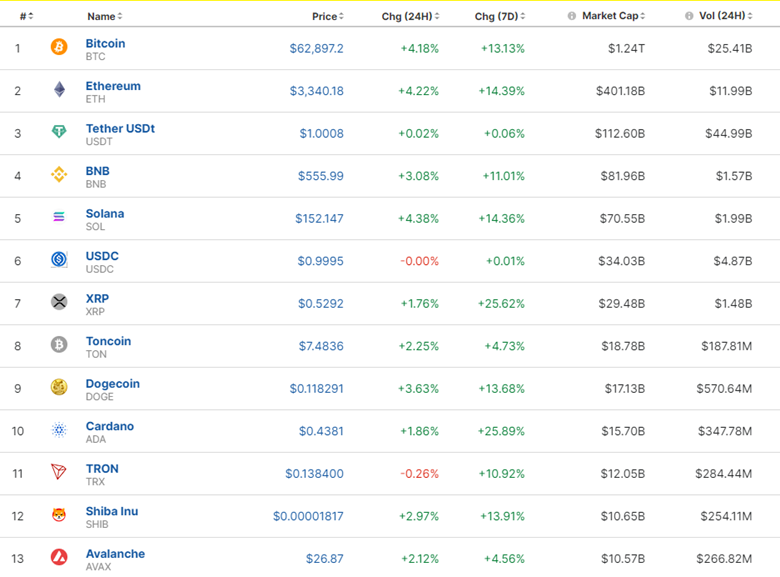
The market has experienced a significant correction. Since June this year, the market has been suffering with most Crypto marking huge losses as it was not improving in July as well. Now mid-July we see a huge comeback.
https://www.investing.com/crypto/currencies
______________________________________________________________________
EQUITY MARKETS MONITOR
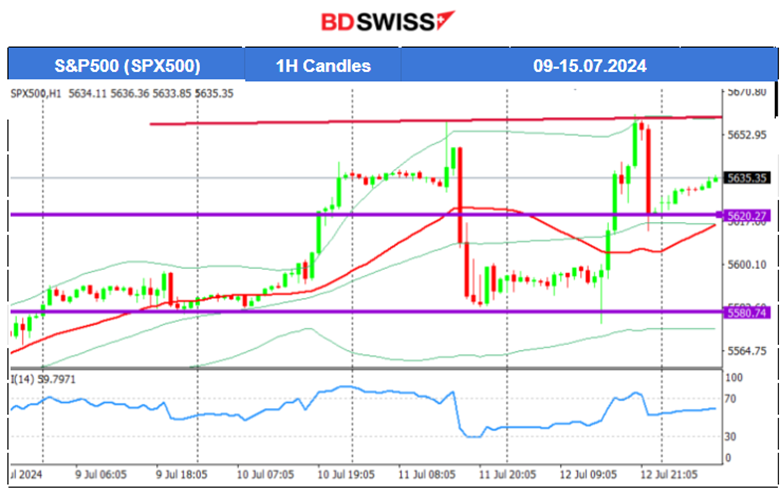
S&P500 (SPX500) 4-Day Chart Summary
Server Time / Timezone EEST (UTC+03:00)
Price Movement
The CPI inflation y/y figure was reported on the 11th and the index dropped as per our forecast in the previous analysis. Expectations about lowered borrowing costs starting in September are boosting investment in stocks. After the shock on the 11th, the market experienced another shock on the 12th after the release of the PPI data, Consumer sentiment and inflation expectations. A jump occurred with the price finding resistance around 5,660 USD before retracing to the intraday mean. Huge volatility for the index last week as depicted on the chart.
 ______________________________________________________________________
COMMODITIES MARKETS MONITOR
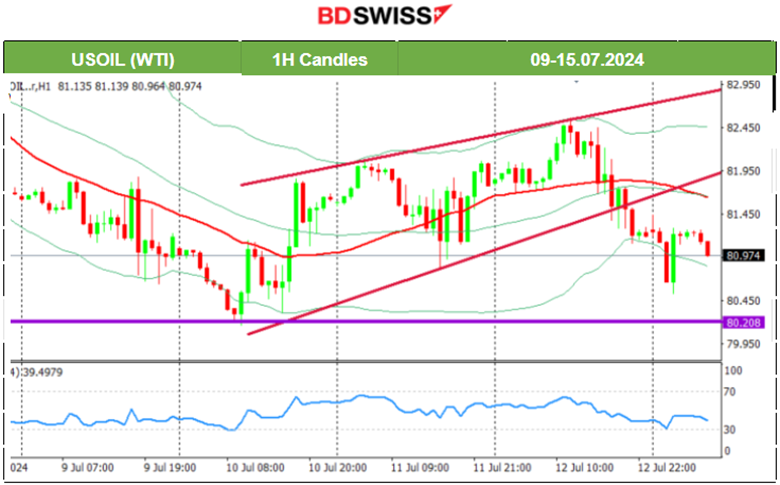
USOIL (WTI) 4-Day Chart Summary
Server Time / Timezone EEST (UTC+03:00)
Price Movement
The price settled near the 80.5 USD/b level, below the MA, but on the 10th it eventually reversed to the upside. This movement was a correction/retracement to the 61.8 Fibo level as depicted on the chart. The price boost to the upside was a result of a reported decline, -3.4M barrels in Crude Oil Inventories in the U.S. against a forecast of 0.7M growth. During the U.S. inflation news yesterday on the 11th Crude oil prices saw some retreat but eventually reversed to the upside. After several tests of the resistance 82.10 USD/b, it finally broke that resistance. After finding strong resistance at near 82.5 USD/b the price reversed to the downside on the 12th breaking that triangle formation. It did not, however, reach the 80.2 USD/b support but it has the potential to do so as long as it moves away from the 81 USD/b level significantly towards the downside.
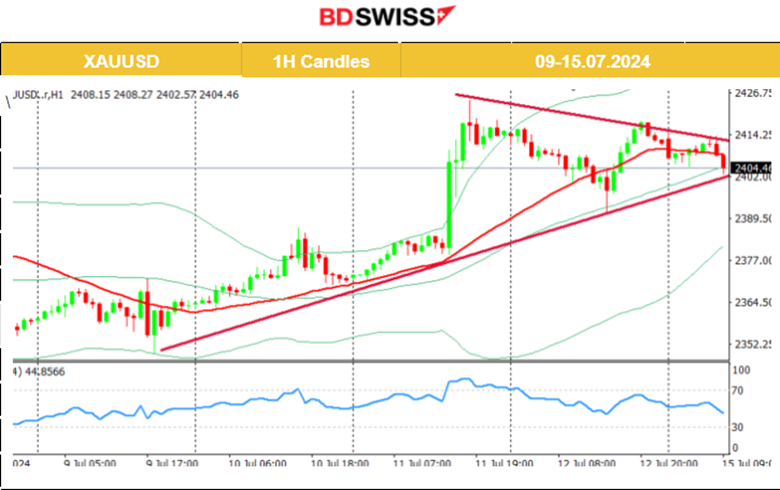
 XAUUSD (Gold) 4-Day Chart Summary
Server Time / Timezone EEST (UTC+03:00)
Price Movement
The price eventually moved to the upside on the 9th of July crossing the 30-period MA on its way up. The target level of 2,380 USD/oz was reached as per our forecast in the previous analysis and the price even moved higher reaching the resistance at 2,387 USD/oz before retracement took place. On the 11th the USD weakening that took place during the U.S. inflation report release caused the price to jump, initially reaching at near the 2400 USD/oz. After testing that resistance intraday, another breakout led to the price reaching even the resistance near 2,423 USD/b before retracing to the MA. On the 12th the price continued with retracement after the previous day’s peak. When it touched the MA it reversed to the upside to continue with a sideways path. A triangle formation is now apparent and we wait for its breakout to take advantage of the rapid movement in one direction that will probably occur. 2,380 USD/oz is the target level for a downward breakout. To the upside target level would be 2,430 USD/oz.
 ______________________________________________________________
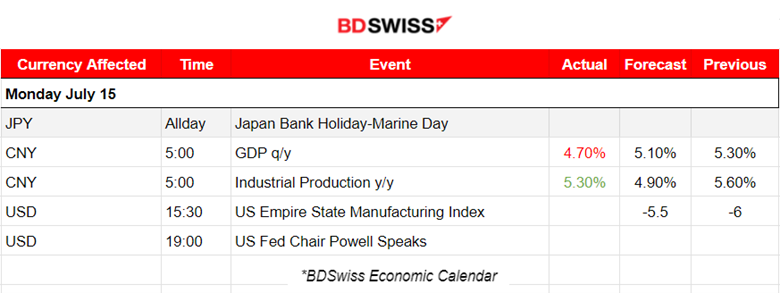
News Reports Monitor – Today Trading Day (15.07.2024)
Server Time / Timezone EEST (UTC+03:00)
 0. Weekend:
An attempt to assassinate former President Donald Trump is driving markets this Monday.
The FBI identified Thomas Matthew Crooks of Bethel Park, Pennsylvania, as the suspect and said the shooting was being investigated as an attempted assassination.
https://www.reuters.com/world/us/trump-shooting-raises-questions-about-security-lapses-2024-07-14/
No important news announcements, no important scheduled releases.
The report at 5:00 for China’s GDP showed weaker-than-expected second-quarter data that points to slowing economic momentum and the need for more stimulus. China’s economy expanded 4.7%, missing analysts’ expectations.
Industrial production, however, beat expectations up by 5.3% in June from a year ago, higher than Reuters’ estimate of 5% growth.
The Empire State Manufacturing index figure will be reported at 15:30 and will probably cause higher volatility for the USD pairs. No major impact is expected in the market.
General Verdict:
______________________________________________________________
 Marios Kyriakou
Posted on 26 August, 2024 at 10:14 GMT
Posted on 23 August, 2024 at 09:24 GMT
Posted on 22 August, 2024 at 11:39 GMT
Posted on 21 August, 2024 at 09:40 GMT
Posted on 20 August, 2024 at 11:51 GMT